
Site benchmarking in construction is the repeatable practice of collecting standardised site metrics, comparing them to like-for-like baselines or industry references, and using the gap analysis to set targets and corrective actions. Get it right and you gain cost predictability, fewer rework cycles, clearer productivity targets, and earlier risk signals. Get it wrong and you’re comparing a high-rise in Sydney CBD to a warehouse in regional Queensland and wondering why the numbers make no sense.
Here is the one-line action sequence every project team needs before they start:
- Define scope and project type
- Choose 3–6 KPIs tied to contract risk
- Collect standardised data using locked templates
- Normalise for location, time, and project complexity
- Analyse gaps against like-for-like peers
- Assign owners and corrective actions
- Retest at defined cadence points
Key takeaways
Site benchmarking in construction works when standardised data, like-for-like normalisation, and clear ownership are combined into a repeatable process tied to specific project phases and contract obligations.
| Point | Details |
|---|---|
| Start with 3–6 KPIs | Choose metrics tied directly to contract risk, such as cost per m², TRIFR, and rework rate. |
| Normalise before comparing | Apply location and time indices to every cost figure; raw comparisons measure geography, not performance. |
| Assign a coordinator | One accountable person for data definitions, templates, and reporting is the single biggest driver of data quality. |
| Benchmark at lifecycle stages | Run comparisons at feasibility, construction, and handover, not only at project close-out. |
| Missiondemolition supports your data | Documented waste, clearance, and productivity records from Missiondemolition feed directly into demolition benchmarking programmes. |
Table of Contents
- How site benchmarking works in construction: definition and types
- What does a practical benchmarking process look like?
- Which KPIs and site metrics should you benchmark?
- How do you collect, store, and standardise site data reliably?
- How do you analyse benchmark data effectively?
- What tools and platforms support site benchmarking in Australia?
- How do you turn benchmark results into real performance improvements?
- What are the most common benchmarking mistakes in construction?
- Applying site benchmarking to demolition and site-preparation projects in Australia
- What benchmarking actually looks like when you run it on a live project
- Missiondemolition’s documented approach to demolition benchmarking
- Sources
How site benchmarking works in construction: definition and types
Benchmarking, as a structured discipline, means comparing your project’s measured performance against a defined reference point, then using that comparison to drive measurable improvement. The reference point is what separates useful benchmarking from gut-feel project reviews. Procore’s summary of construction benchmarking identifies four main types, each suited to a different purpose.
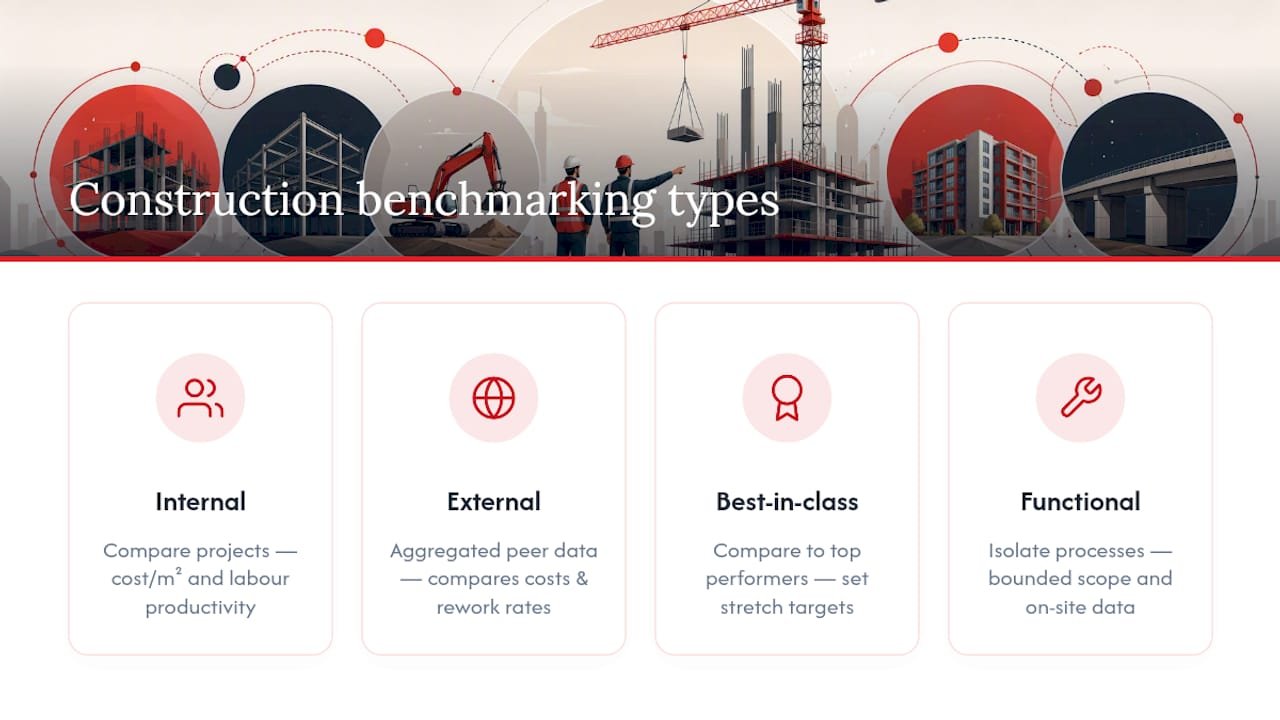
Internal benchmarking compares performance across your own project portfolio. It is the natural starting point for any contractor with more than two or three completed projects in the same category. The data is accessible, the definitions are consistent, and the politics are manageable. Use it first for cost-per-m² variance and labour productivity.
External or industry benchmarking pulls in aggregated peer data from industry databases. This is where you find out whether your cost per tonne of demolition waste is competitive or whether your rework rate sits in the bottom quartile of the market. The trade-off is data quality: external pools are only as good as the normalisation applied to them.
Best-in-class or strategic benchmarking compares your performance to the top performers in the industry, not just the average. It is most useful when setting stretch targets for value engineering conversations or when preparing a tender that needs to demonstrate efficiency credentials.
Functional benchmarking isolates a specific process, such as earthworks, asbestos clearance, or concrete pours, and compares that process in isolation. For demolition contractors, this is often the most practical entry point because the scope is bounded and the data is already being generated on site.
What does a practical benchmarking process look like?
The Construction Industry Institute’s formal 10-step benchmarking model is the most widely referenced process framework in the industry. It runs from organisational commitment through to engagement with data-analytics communities for continuous improvement. For most project teams, a condensed version of that model is more practical.
- Secure leadership commitment. Without a sponsor who controls budget and reporting lines, benchmarking stalls at the pilot stage. Get a named executive or project director on record before you start.
- Appoint a benchmarking coordinator. This role owns the data definitions, the capture templates, and the reporting schedule. One person, clearly accountable, makes the difference between a programme that runs and one that produces a single report and dies.
- Scope your metrics and project phases. Decide which phases and processes you are benchmarking before data collection starts. Changing scope mid-project corrupts the dataset.
- Standardise data capture. Lock the template. Define every field, unit, and frequency before the first data point is entered. Train field staff on the definitions, not just the software.
- Collect data during execution. Retrospective data collection from memory or from incomplete site diaries produces noise, not signal. Capture at the point of work.
- Normalise and cleanse. Remove location and time variance, exclude identifiable abnormals (weather events, sovereign risk, force majeure), and validate against source documents.
- Analyse gaps. Compare normalised results to your chosen reference pool. Identify where you sit in the distribution and which gaps are large enough to act on.
- Set targets and action plans. Translate gap analysis into specific, owned improvement targets. Assign a responsible person and a deadline to each.
- Report results. Produce a dashboard for site operations and an exception report for the executive. Make the format repeatable so stakeholders know what to expect and when.
- Repeat. Benchmarking is not a post-mortem. Run it at defined lifecycle points: feasibility, detailed design, construction, and handover.
Pro Tip: Start with a process where data is already being generated, such as safety inspections or quality hold-point sign-offs. Piloting on existing data minimises early noise and produces a quick win that builds stakeholder confidence before you scale.
The gap between pilot projects and enterprise adoption is one of the most common barriers to credible benchmarks. Autodesk’s research on construction benchmarking confirms that inconsistent digital adoption and non-standardised inputs are the primary reasons benchmarking programmes stall. Starting narrow and proving the model before scaling is not a compromise; it is the correct sequence.
Which KPIs and site metrics should you benchmark?
Choosing the right metrics is where most teams either get it right or waste six months collecting data that nobody acts on. The goal is a balanced set of 3–6 KPIs that map directly to contract risk and value engineering conversations, not a dashboard that impresses in a boardroom but confuses a site supervisor.
Core KPI groups for construction site benchmarking:
- Cost: cost per m², cost per m³ (demolition and earthworks), cost variance against budget, cost at completion forecast
- Schedule: percent plan complete (PPC), cycle times per phase, milestone adherence rate
- Productivity: direct labour hours per scope unit (m², m³, tonne), crew productivity index, plant utilisation rate
- Quality: defect rate per inspection, rework hours as a percentage of total direct hours, number of non-conformance reports (NCRs) per phase
- Safety: Total Recordable Injury Frequency Rate (TRIFR), Lost Time Injuries (LTIs), near-miss reporting rate
- Environmental: waste diverted from landfill (percentage), carbon intensity (kgCO₂e per m² or per tonne), hazardous waste disposal cost
- Variation and change: number of variations per phase, variation cost as a percentage of contract value, change order cycle time
RICS guidance on cost analysis and benchmarking provides industry-standard templates for cost and carbon comparison across project and lifecycle stages, which quantity surveyors can adapt directly for Australian projects.
Pro Tip: Map each KPI to a specific contract clause or risk register item before you finalise the list. If a metric does not connect to a cost, schedule, or quality obligation in your contract, it is probably a nice-to-have rather than a must-track.
For labour productivity tracking, the most reliable unit is direct labour hours per scope unit, measured at the crew level and captured daily. Weekly aggregation loses the signal in the noise.
How do you collect, store, and standardise site data reliably?
Data collection is where benchmarking programmes succeed or fail in practice. The sources are straightforward: daily site diaries, timesheets, ERP and financial systems, quality inspection logs, safety management systems, and equipment telematics. The problem is that most projects run these systems in parallel without connecting them, which means the data warehouse never gets a clean, complete record.
A minimum dataset for each benchmarked project phase should capture:
- Project ID and phase identifier
- Location factor (state, region, remoteness classification)
- Date and reporting period
- Scope unit (m², m³, lineal metres, tonnes)
- Direct labour hours by trade
- Material quantities and cost lines
- Rework hours (separately coded)
- Safety incidents by type
- Equipment hours and utilisation
Normalisation is the step that most teams skip and then wonder why their benchmarks are misleading. BCIS recommends applying location and time indices to normalise project costs before any comparison is made. Without this step, you are comparing price fluctuations and geography rather than actual performance. In Australia, location factors vary significantly between capital city CBD sites, suburban projects, and regional or remote locations. Time indices account for material and labour cost escalation across reporting periods.
The storage architecture matters as much as the capture process. A single cloud-based data warehouse, with standard templates and role-based access controls, is the minimum viable infrastructure for a credible benchmarking programme. Centralising team updates and document workflows into a single source of truth prevents the fragmented, multi-tool problem that Autodesk identifies as the most common barrier to standardised benchmarking.
Data governance roles are not optional. You need a defined data owner for each source system, a validation rule set that flags missing or out-of-range entries, and a submission deadline that field staff are trained to meet.
Pro Tip: Lock the capture template and run a half-day training session with field staff before the pilot starts. The most common data quality failure is not dishonesty; it is field staff filling in fields differently because nobody agreed on the definitions.
How do you analyse benchmark data effectively?
Basic analysis covers the ground that most project teams need most of the time. Normalised averages and percentile distributions tell you where your project sits relative to the reference pool. Trend lines across reporting periods show whether performance is improving or deteriorating. Control charts flag when a metric has moved outside its normal range and needs investigation. Segment analysis, breaking results down by project type, size, phase, and delivery model, is what separates a meaningful comparison from an apples-to-oranges one.
The workflow for a normalised comparison looks like this: remove location and time variance using your chosen index, exclude identifiable abnormals with documented justification, calculate productivity per scope unit for each reporting period, then plot your result against the like-for-like peer percentile distribution. The 25th, 50th, and 75th percentile positions give you a practical read on where you stand and what is achievable.
For firms wanting to go further, Data Envelopment Analysis (DEA) is an advanced method that assesses efficiency across multiple inputs and outputs simultaneously. Where KPI dashboards show you that labour productivity is low, DEA can reveal whether the root cause is excess labour, underutilised plant, or a combination of both, and it can identify which peer projects represent the best-practice frontier for resource allocation. It is most useful for enterprise-level comparisons across business units rather than for single-project reviews.
The practical limit of KPI-only approaches is that they measure outcomes without explaining the system that produced them. DEA and frontier analysis fill that gap when the objective is firm-level efficiency improvement rather than project-level course correction.
What tools and platforms support site benchmarking in Australia?
No single platform does everything, and the right stack depends on project scale, existing systems, and budget. The categories to evaluate are:
Mobile field-capture apps handle daily data entry at the point of work. Look for offline capability (critical on remote Australian sites), configurable forms, and direct export to your data warehouse. Entry-level options are available for small contractors; enterprise platforms integrate with ERP and project controls.
Project controls and ERP systems are the source of record for cost, schedule, and resource data. The benchmarking requirement here is that the system can export standardised data in a consistent format across projects, not just produce project-specific reports.
Data warehouse and BI platforms are where normalisation, aggregation, and visualisation happen. Tools like Microsoft Power BI, Tableau, and cloud data warehouses such as Google BigQuery or Snowflake are used across Australian construction firms for this layer. The key requirement is the ability to apply location and time factors as calculated fields and to maintain an audit log of normalisation decisions.
Telematics and IoT feed plant utilisation and equipment hours directly into the data warehouse, removing manual entry errors from one of the most frequently mis-captured data fields.
Selection checklist for any platform:
- Single source of truth architecture with open APIs
- Support for geo and time normalisation as configurable parameters
- Role-based access controls and audit logs
- Exportable, standardised templates
- Local Australian support and compliance with NSW and state-level reporting requirements
- Australian currency and unit support (AUD, m², m³, tonnes)
For rolling out new technology and process change across construction teams, the change management approach matters as much as the platform choice. Field adoption is the bottleneck, not software capability.
How do you turn benchmark results into real performance improvements?
A benchmark report that sits in a shared drive is not a benchmarking programme. The conversion from insight to improvement requires three things: targets that are specific and achievable, governance that assigns ownership, and a reporting cadence that keeps the data visible.
Setting targets: use peer percentile positions as your anchor. Moving from the 40th to the 60th percentile in labour productivity is a credible short-term target for most projects. Moving from the 40th to the 90th in a single reporting period is not. Tie targets to sprint cycles of four to eight weeks so progress is visible before the project phase closes.
Governance and roles: a compact RACI for a project-level benchmarking programme looks like this:
- Benchmarking coordinator: Responsible for data collection, normalisation, and report production
- Project manager: Accountable for target setting and corrective action sign-off
- Cost controller / QS: Consulted on cost KPI definitions and variance explanations
- Field supervisor: Responsible for daily data capture and rework coding
Reporting cadence: weekly exception reports for site operations (flag deviations from target), monthly project-level benchmarking reviews (trend analysis and action plan progress), quarterly cross-project benchmarking (portfolio-level comparison and target recalibration). BCIS recommends benchmarking at multiple lifecycle stages rather than only at project completion, so that trends inform future estimating rather than producing only a post-mortem.
Pro Tip: Publish the benchmark dashboard somewhere the site team can see it, not just the executive. When field supervisors can see their crew’s productivity trend against the target, the data becomes a management tool rather than a compliance exercise.
What are the most common benchmarking mistakes in construction?
Most benchmarking failures are predictable and preventable. Here are the pitfalls that appear most often, and the fix for each.
- Inconsistent data capture across projects. Different field staff use different definitions for the same field. Fix: agree definitions in writing, lock the template, and train before the pilot starts.
- Mixing incompatible project types. Comparing a constrained inner-city demolition to a greenfield industrial site produces meaningless results. Fix: segment your reference pool by project type, size, and delivery model before running any comparison.
- Skipping normalisation. Comparing raw costs across different states and time periods measures geography and inflation, not performance. Fix: apply location and time indices to every cost figure before comparison.
- Overloading KPIs. Tracking 20 metrics produces a reporting burden that field staff ignore. Fix: start with 3–6 KPIs tied directly to contract risk and add metrics only when the programme is stable.
- Poor change management. Benchmarking requires field staff to change how they record data. Without training and visible leadership support, adoption rates drop and data quality collapses. Fix: treat the rollout as a change programme, not a software implementation.
The remediation sequence for a programme that has already gone off the rails: agree definitions first, pilot on a narrow scope with existing data, normalise for location and time, store data centrally in a single warehouse, and communicate early wins to build momentum before expanding scope.
Applying site benchmarking to demolition and site-preparation projects in Australia
Demolition and site-preparation work has a distinct set of KPIs that general construction benchmarking frameworks do not always capture well. The scope is bounded, the productivity units are concrete, and the regulatory requirements in Australia add a compliance dimension that needs to be built into the data model from the start.
Specific KPIs for demolition benchmarking:
- Cubic metres of material removed per day (by structure type and method)
- Cost per tonne of waste, segmented by waste stream (inert, recyclable, hazardous)
- Asbestos clearance turnaround time (days from identification to clearance certificate)
- Plant utilisation rate (productive hours as a percentage of available hours)
- Rework hours attributable to unauthorised scope variations
- Disposal cost per tonne by waste category
Normalising demolition cost per m³ requires two adjustments beyond the standard location and time indices: a complexity factor for asbestos-containing materials (ACMs) and a constrained-access factor for sites with limited plant movement or proximity to live structures. A demolition project in a congested Sydney CBD block is not comparable to a standalone warehouse clearance in Western Sydney without appropriate complexity and access adjustments.
Regulatory alignment is not optional. In NSW, the Work Health and Safety Act 2011 and the Asbestos-related Diseases (Occupational Exposure) Compensation Act 2011 set the compliance framework for asbestos handling and incident reporting. Your data capture template needs fields for clearance certificate numbers, licensed contractor identifiers, and incident classifications that align with SafeWork NSW reporting categories. This is not just good governance; it is a legal requirement.
Practical actions for a demolition benchmarking pilot:
- Select one project type (for example, residential house demolition) and lock the scope
- Define productivity in m³ removed per crew-day, with separate codes for asbestos and non-asbestos scope
- Capture waste tonnage and disposal cost per load, by waste stream
- Record plant hours against productive output daily
- Log every clearance certificate with date, licensed contractor, and scope reference
- Review against internal benchmarks at four-week intervals and adjust targets
For active demolition and excavation projects, plant utilisation is often the highest-leverage metric because idle plant time is both a cost driver and a schedule risk.
What benchmarking actually looks like when you run it on a live project
The theory of benchmarking is clean. The practice is messier, and that gap is worth naming directly.
The first thing that goes wrong on most pilots is the data capture template. It looks complete in the planning meeting and falls apart on day three when a field supervisor realises that the “scope unit” field does not account for partial demolitions or mixed-material structures. The fix is not a better template; it is a half-day walkthrough with the people who will actually fill it in, before the project starts.
The second thing that goes wrong is the coordinator role. When it is assigned as a part-time addition to an existing project manager’s workload, it gets deprioritised every time a site issue comes up, which is constantly. A dedicated coordinator, even part-time, with a clear mandate and visible executive support, produces materially better data quality and submission rates. The CII’s benchmarking programme guidance is explicit on this point: the coordinator role is not administrative; it is the engine of the programme.
What actually builds stakeholder buy-in is not a polished report. It is a visible, repeatable dashboard that field supervisors and project managers can read in under two minutes. When the site team can see their own productivity trend against the target, the benchmark stops being a management imposition and starts being a tool they use. That shift in perception is what separates a benchmarking programme that runs for three years from one that produces a single report and gets quietly abandoned.
Start small, show a quick win within the first four weeks, and invest in the standards and training before you invest in the software. The platform matters less than the discipline.
Missiondemolition’s documented approach to demolition benchmarking
Benchmarking a demolition project requires a contractor who captures the right data during execution, not one who reconstructs it from memory at project close-out. Missiondemolition’s professional demolition services in Sydney are built around documented project reporting: waste tonnage by stream, plant utilisation records, asbestos clearance certificates, and site-preparation productivity data that project managers and quantity surveyors can use directly in their benchmarking programmes.

The team is fully licensed for asbestos removal and operates under NSW safety and environmental regulations, which means the compliance data your benchmark needs is already being captured as part of standard project delivery. With 24/7 support and transparent project documentation, Missiondemolition gives you the data trail that makes benchmarking reliable rather than retrospective. To get a quote or discuss how your next demolition project can be set up for benchmarking from day one, contact Missiondemolition directly through the demolition services page.
Sources
The sources below cover the process models, normalisation principles, advanced analysis methods, and practical implementation guidance referenced throughout this article.
- Benchmarking Associates Guide
- BCIS basics: six reasons to benchmark in construction
- What is Benchmarking in Construction? (And How to Get It Right)
- Using Construction Benchmarking for Better Project Outcomes | Procore
- Cost analysis and benchmarking
